Category:Scraping Use Cases
How to Scrape Google Trends with Python (both Explore & Trending Now pages)

Head of Marketing


To this day, I'm still surprised that we get Google Trends for free.
Recently I've been trying to scrape the trends and incorporate it more into my weekly reports.
But, as you might know, scraping Google is pretty hard to do at scale.
So I've used Python and Scrape.do to create automated scrapers that go and check the trends for me regularly.
I'm not going to lie, it gets pretty complex at times but it's worth it.
You can find the complete scripts in the GitHub repository.
If you prefer to skip the scraping complexity, Scrape.do also offers dedicated plugin endpoints for both targets. They return fully parsed JSON in a single request, no token management or browser rendering needed. Jump to scraping Google Trends with the plugin API or getting trending topics if that's what you need.
Scraping Google Trends Explore Data
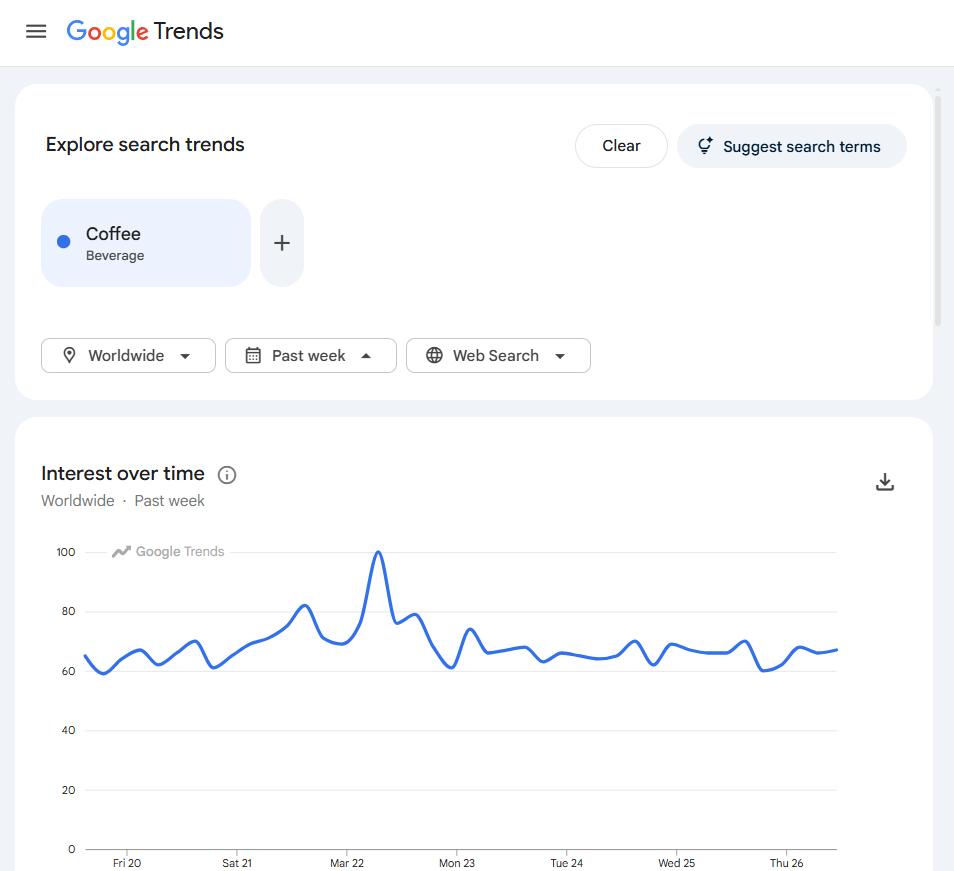
Google Trends explore data covers three datasets for any keyword: interest over time (a 0-100 index over a configurable timeframe), interest by region (country or state-level breakdown), and related queries (top and rising).
The explore page at trends.google.com/trends/explore does not embed this data in the initial HTML. It loads a shell page, then populates charts and tables through internal API calls to trends.google.com/trends/api/.
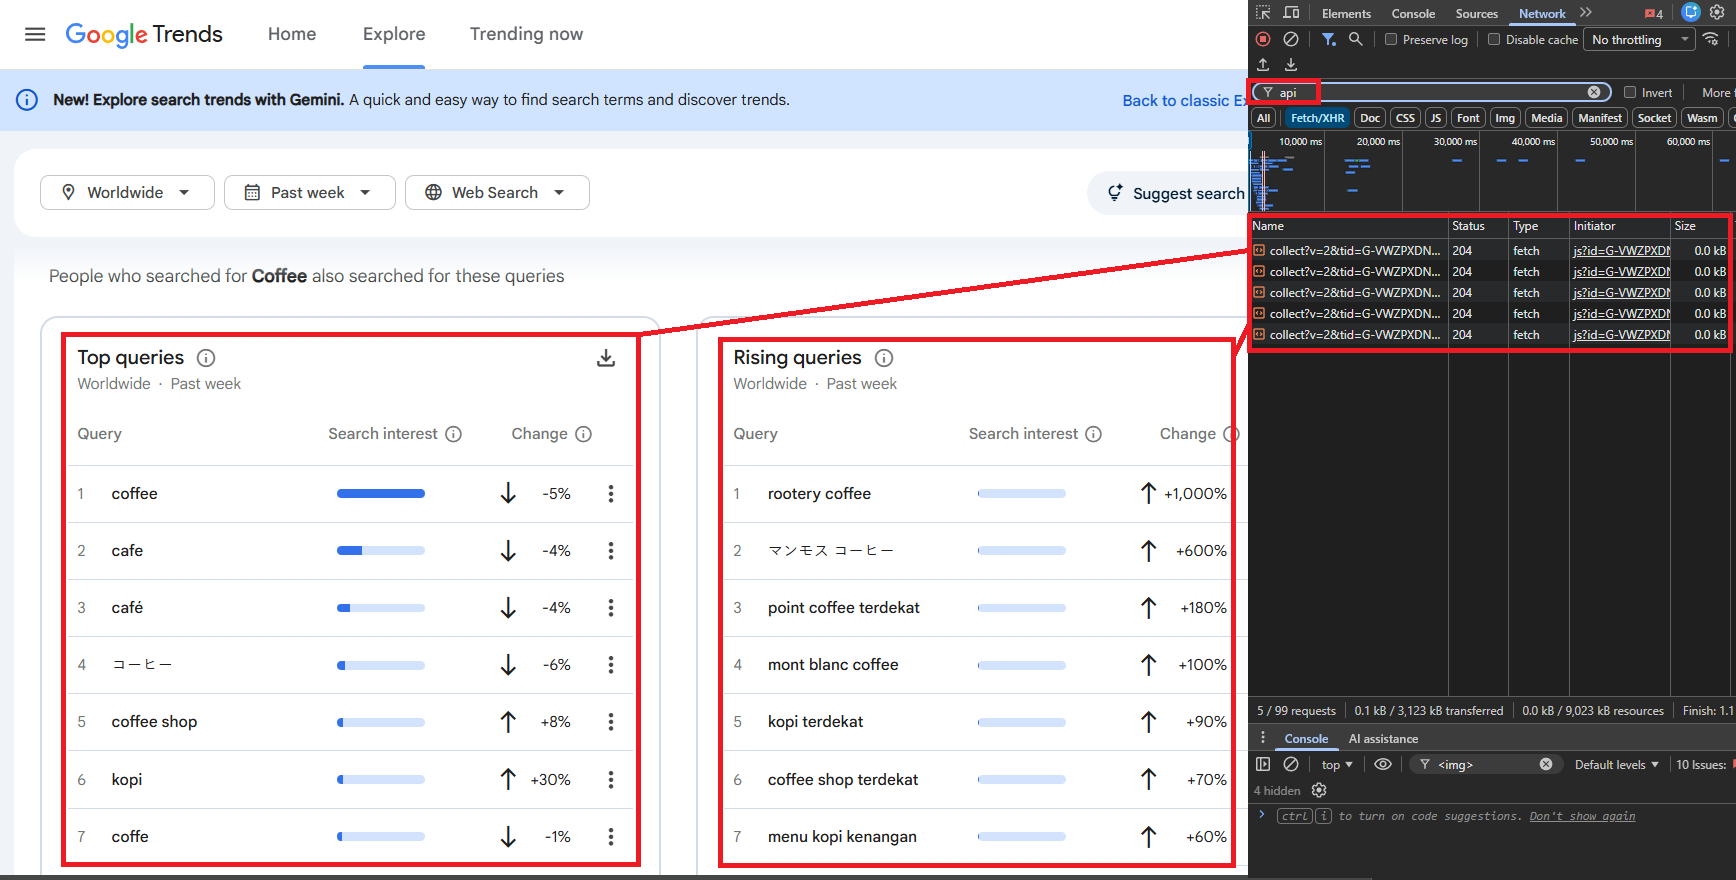
The internal API uses a two-step flow: a request to the /explore endpoint returns widget tokens (one per data type), then each token is exchanged against a /widgetdata/ endpoint to fetch the actual data. No browser rendering is needed. The API returns JSON (prefixed with )]}' as an anti-XSSI measure), so the scraper works with plain HTTP requests through Scrape.do.
The Quick Way: Plugin API
If you just need the data without managing the widget token flow, the /plugin/google/trends endpoint handles everything and returns clean JSON directly. Each request costs 10 credits.
curl "https://api.scrape.do/plugin/google/trends?token=<your_token>&q=coffee&geo=US"The default response includes both interest over time and interest by region:
{
  "search_parameters": {
    "q": "coffee",
    "geo": "US",
    "hl": "en",
    "date": "today 12-m"
  },
  "interest_over_time": {
    "timeline_data": [
      {
        "date": "Apr 6 – 12, 2025",
        "timestamp": "1743897600",
        "values": [{"query": "coffee", "value": "69", "extracted_value": 69}]
      }
    ]
  },
  "interest_by_region": [
    {"geo": "US-HI", "location": "Hawaii", "value": "100", "extracted_value": 100},
    {"geo": "US-WY", "location": "Wyoming", "value": "87", "extracted_value": 87},
    {"geo": "US-MT", "location": "Montana", "value": "81", "extracted_value": 81}
  ]
}
Pass data_type=RELATED_QUERIES for top and rising queries:
curl "https://api.scrape.do/plugin/google/trends?token=<your_token>&q=coffee&geo=US&data_type=RELATED_QUERIES"{
"related_queries": {
"top": [
{"query": "coffee near me", "value": "100", "extracted_value": 100},
{"query": "coffee shop", "value": "86", "extracted_value": 86},
{"query": "coffee maker", "value": "66", "extracted_value": 66}
],
"rising": [
{"query": "shop pour over coffee makers", "value": "+4,050%", "extracted_value": 4050},
{"query": "how to remove coffee stain from carpet", "value": "+2,500%", "extracted_value": 2500},
{"query": "javvy protein coffee", "value": "+2,400%", "extracted_value": 2400}
]
}
}If you need more control such as custom timeframes, the full widget token flow, or additional filtering, you can keep reading for the complete Python scraper.
Prerequisites
The scraper uses only requests and standard library modules:
pip install requestsA Scrape.do account provides the API token. Free tier available at scrape.do/register.

Configuration Parameters
The script exposes six configuration variables that control what data gets fetched:
import requests
from urllib.parse import quote
import json

token = "<your_token>"
keyword = "coffee"
timeframe = "today 3-m"
geo = ""           # "" = worldwide; "US", "GB", "TR" = country; "US-CA" = state
category = 0       # 0 = all; 3 = Business, 71 = Science/Tech
property_filter = ""  # "" = Web, "youtube", "news", "images", "froogle"
hl = "en-GB"
tz = -180          # minutes offset: -180 = UTC+3, 0 = UTC
keyword is the search term to track. geo filters by geography (empty for worldwide, country codes like "US" or state codes like "US-CA" to narrow down). timeframe controls the date range: "now 1-H" (past hour), "today 1-m" (past 30 days), "today 3-m" (past 90 days), "today 12-m" (past 12 months), "today 5-y" (past 5 years). property_filter selects the search property: empty for Web Search, "youtube" for YouTube, "news" for Google News.
The Scrape.do Request Wrapper
Every request to the Google Trends internal API passes through Scrape.do. The wrapper function constructs the proxy URL and strips the anti-XSSI prefix before parsing:
ENDPOINTS = {
    "TIMESERIES": "multiline",
    "GEO_MAP": "comparedgeo",
    "RELATED_QUERIES": "relatedsearches",
}
BASE = "https://trends.google.com/trends/api"


def scrape_do(url):
    resp = requests.get(
        "https://api.scrape.do/?token=" + token
        + "&url=" + quote(url, safe=""),
        timeout=60,
    )
    resp.raise_for_status()
    text = resp.text
    return json.loads(text[5:] if text.startswith(")]}'") else text)
Google Trends API responses start with )]}' (a JSON hijacking prevention prefix). The wrapper strips the first 5 characters before parsing.
The ENDPOINTS dict maps widget IDs to their corresponding /widgetdata/ sub-paths: TIMESERIES maps to multiline, GEO_MAP maps to comparedgeo, RELATED_QUERIES maps to relatedsearches.
Fetching Widget Tokens
The first step builds a JSON request payload and sends it to the /explore endpoint. The response returns a list of widget objects, each with an id, a token string, and a request object that gets passed back to fetch the actual data:
def get_widgets():
    req = json.dumps({
        "comparisonItem": [
            {"keyword": keyword, "geo": geo, "time": timeframe}
        ],
        "category": category,
        "property": property_filter,
    }, separators=(",", ":"))
    data = scrape_do(
        f"{BASE}/explore?hl={hl}&tz={tz}&req={quote(req)}"
    )
    return {w["id"]: w for w in data["widgets"] if w["id"] in ENDPOINTS}


def fetch_widget(widget):
    endpoint = ENDPOINTS[widget["id"]]
    req = json.dumps(widget["request"], separators=(",", ":"))
    return scrape_do(
        f"{BASE}/widgetdata/{endpoint}?hl={hl}&tz={tz}"
        f"&req={quote(req)}&token={widget['token']}"
    )
get_widgets() fetches the explore page and filters to keep only the three widget types we need: TIMESERIES, GEO_MAP, and RELATED_QUERIES. fetch_widget() exchanges a widget's token for the actual data.
Extracting Interest Over Time
With the TIMESERIES widget token, the script calls fetch_widget() and processes the timeline data:
widgets = get_widgets()
result = {"keyword": keyword, "timeframe": timeframe, "geo": geo or "Worldwide"}

time_data = fetch_widget(widgets["TIMESERIES"])
result["interest_over_time"] = [
    {
        "time": p["formattedTime"],
        "value": p["value"][0],
        "has_data": p["hasData"][0],
    }
    for p in time_data["default"]["timelineData"]
]
The response contains a default.timelineData array where each entry has formattedTime (human-readable date), value (list of interest scores, index 0 for single keyword), and hasData (boolean). For "coffee" with today 3-m timeframe, the output contains 91 daily data points ranging from 47 to 100.
Extracting Interest by Region
The GEO_MAP widget returns geographic interest data:
geo_data = fetch_widget(widgets["GEO_MAP"])
result["interest_by_region"] = [
    {
        "country_code": e["geoCode"],
        "country": e["geoName"],
        "value": e["value"][0],
    }
    for e in geo_data["default"]["geoMapData"] if e["hasData"][0]
]
Each entry has geoCode (ISO country/region code), geoName (human-readable name), and value (interest score 0-100). Entries where hasData is false are filtered out. When geo is set to a specific country (e.g., "US"), the regional breakdown switches to state-level data. Pairing this regional breakdown with location data from Google Maps adds local business context to geographic interest patterns.
For "coffee" with worldwide scope, Singapore scores 100 (highest), followed by St Helena (84), Australia (83), Malaysia (80), and the United States (77).
Extracting Related Queries
The RELATED_QUERIES widget returns two ranked lists: top (most searched related queries by absolute volume) and rising (queries with the largest growth in search frequency):
ranked = fetch_widget(widgets["RELATED_QUERIES"])["default"]["rankedList"]
result["related_queries"] = {
    "top": [
        {"query": kw["query"], "value": kw["value"]}
        for kw in ranked[0].get("rankedKeyword", [])
    ] if ranked else [],
    "rising": [
        {"query": kw["query"], "change": kw["formattedValue"]}
        for kw in ranked[1].get("rankedKeyword", [])
    ] if len(ranked) > 1 else [],
}
Each top query has a value scored 0-100 relative to the most common related query. Rising queries show percentage changes like "+1,050%". For "coffee" over 90 days, top related queries include "coffee shop" (100), "coffee near me" (90), "coffee machine" (76). Rising queries include "how to brew pour over coffee" (+1,050%). Product-focused queries like "coffee machine" often signal purchase intent that Google Shopping data can validate with real pricing and availability.
Saving the Output
The script consolidates all three datasets and writes to JSON:
with open("google-trends.json", "w", encoding="utf-8") as f:
    json.dump(result, f, indent=2, ensure_ascii=False)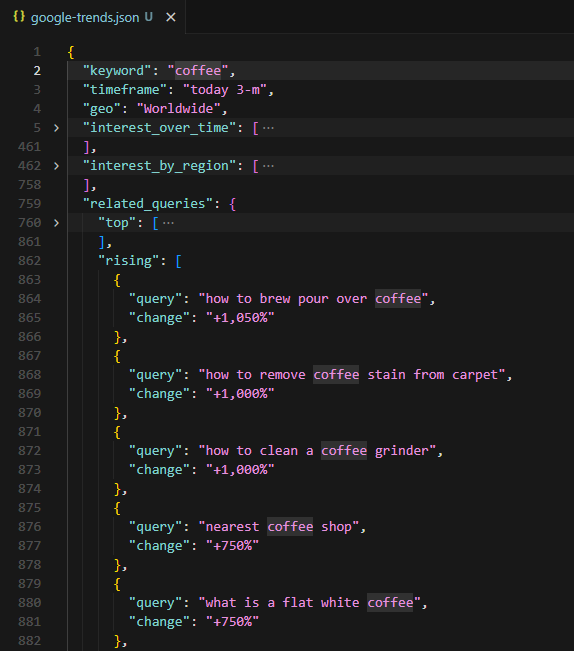
The terminal output summarizes what was collected: number of time points, number of countries, number of top queries, and number of rising queries. The JSON file contains the full dataset with metadata.
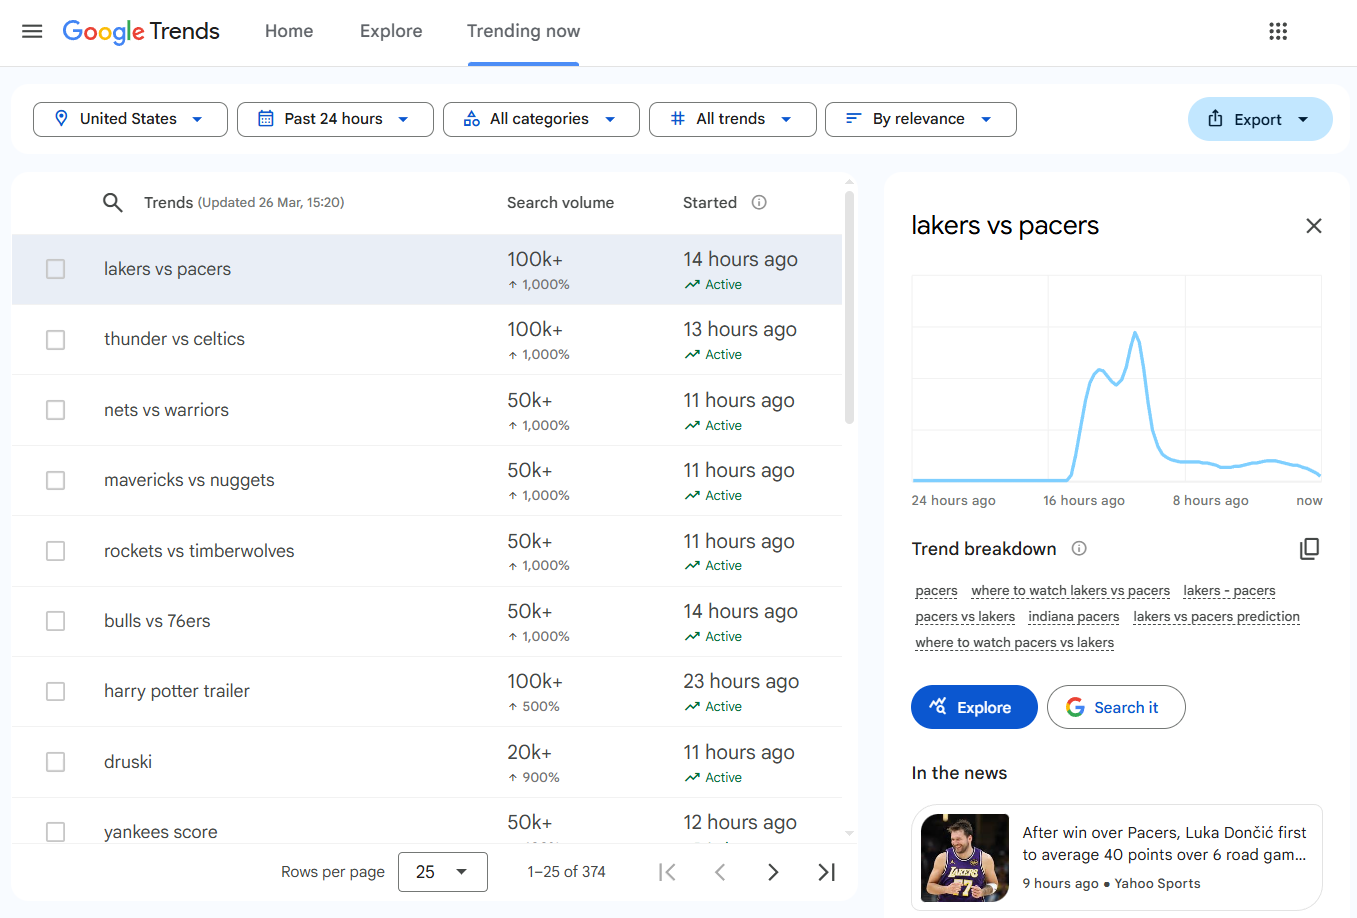
Scraping Google Trending Now
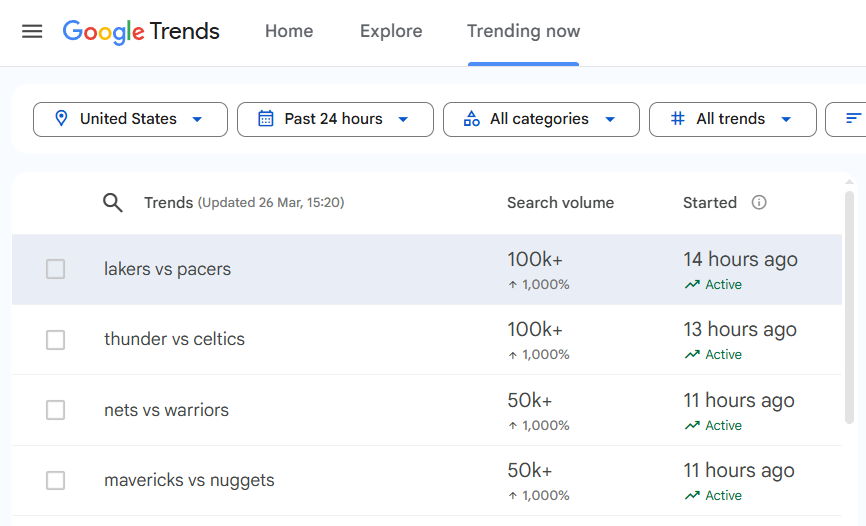
The Trending Now page at trends.google.com/trending shows real-time trending searches with search volume, growth percentage, start time, status (Active/Ended), related queries, and linked news articles.
Unlike the explore data (which uses internal API endpoints), the Trending Now page loads all content through JavaScript rendering. The HTML shell contains no trend data until the browser executes JavaScript and populates the DOM.
This requires Scrape.do's render=true parameter (headless browser rendering), super=true (residential proxy for anti-bot bypass), and playWithBrowser (browser automation actions to wait for and interact with elements).
The Quick Way: Plugin API
The /plugin/google/trending endpoint returns all trending topics as structured JSON without any browser rendering. Each request costs 10 credits.
curl "https://api.scrape.do/plugin/google/trending?token=<your_token>&geo=US&hours=24"The response includes search volume, growth percentage, status, and related queries for every trending topic:
{
  "search_parameters": {
    "geo": "US",
    "hl": "en",
    "hours": 24,
    "cat": 0,
    "sort": "relevance",
    "status": "all"
  },
  "trends": [
    {
      "title": "masters leaderboard",
      "search_volume": 500000,
      "growth_percentage": 1000,
      "started_at": 1775733600,
      "status": "active",
      "related_queries": ["masters leaderboard", "masters leaderboard 2026", "the masters leaderboard"]
    },
    {
      "title": "lakers vs warriors",
      "search_volume": 200000,
      "growth_percentage": 1000,
      "started_at": 1775733600,
      "status": "active",
      "related_queries": ["lakers vs warriors", "lakers vs golden state warriors", "lakers - warriors"]
    }
  ]
}
The hours parameter accepts 4, 24, 48, or 168 (7 days). If you also need the linked news articles per trend, the manual scraper below extracts those through browser automation.
Configuring the Request
Four configuration variables control the scraper:
import requests
import urllib.parse
import json
import re
from bs4 import BeautifulSoup

token = "<your_token>"
geo = "US"
hours = 24        # 4, 24, 48, or 168 (7 days)
fetch_articles = True   # False to skip detail extraction (saves API credits)
max_details = 5   # Trends to fetch articles for (each costs 1 API call)

target_url = f"https://trends.google.com/trending?geo={geo}&hours={hours}"
encoded_url = urllib.parse.quote_plus(target_url)
The build_api_url() function assembles the full Scrape.do request URL with rendering parameters and browser actions:
def build_api_url(actions):
    encoded_actions = urllib.parse.quote_plus(json.dumps(actions))
    return (
        f"http://api.scrape.do/?token={token}"
        f"&url={encoded_url}&render=true&super=true"
        f"&playWithBrowser={encoded_actions}"
    )
The playWithBrowser parameter takes a JSON array of browser automation actions. Each action specifies what the headless browser should do before returning the rendered HTML.
Fetching and Parsing the Trends Table
The first request uses two browser actions: Wait (5 seconds for initial page load) and Wait Selector targeting table tbody tr (waits until the trends table rows are present in the DOM):
actions = [
    {"Action": "Wait", "Timeout": 5000},
    {"Action": "Wait Selector", "Selector": "table tbody tr"},
]
response = requests.get(build_api_url(actions), timeout=120)
soup = BeautifulSoup(response.text, "html.parser")
The response is fully rendered HTML. The parse_trends_table() function iterates over each table row and extracts the data:
def parse_trends_table(soup):
    trends = []
    for row in soup.select("table tbody tr"):
        cells = row.find_all("td")
        if len(cells) < 5:
            continue

        name_div = cells[1].select_one("div.mZ3RIc")
        if not name_div:
            continue

        vol_text = cells[2].get_text(" ", strip=True)
        vol_match = re.match(r"([\d,]+K?\+?)", vol_text)
        change_match = re.search(r"([\d,]+%)", vol_text)

        started_text = cells[3].get_text(" ", strip=True)
        started_match = re.match(r"([\d]+ \w+ ago)", started_text)

        skip_words = {"Search term", "query_stats", "Explore", ""}
        related = []
        for text_node in cells[4].find_all(string=True):
            t = text_node.strip()
            if t and t not in skip_words and len(t) > 2 and not t.startswith("+"):
                if t not in related:
                    related.append(t)

        trends.append({
            "name": name_div.get_text(strip=True),
            "search_volume": vol_match.group(1) if vol_match else "N/A",
            "volume_change": change_match.group(1) if change_match else "N/A",
            "started": started_match.group(1) if started_match else "N/A",
            "status": "Active" if "Active" in started_text else "Ended",
            "related_queries": related[:5],
            "articles": [],
        })
    return trends
Each row has 5+ <td> cells. Cell 1 contains the trend name inside div.mZ3RIc. Cell 2 contains search volume and volume change (extracted via regex). Cell 3 contains the start time as a relative string like "21 hours ago". Cell 4 contains related queries as text nodes.
Status is determined by checking whether "Active" appears in the started cell text. Otherwise the trend is marked "Ended".
Extracting News Articles per Trend
The second pass clicks each trend row to expand its detail panel, which contains linked news articles from Google News. For deeper extraction of those news sources, the Google News scraping guide covers full-content download with pagination. Each detail request uses four browser actions: Wait, Wait Selector for the table rows, Click on the specific row, and another Wait for the panel to populate:
def extract_articles(soup):
    articles = []
    panel = soup.select_one("div.EMz5P")
    if not panel:
        return articles
    for a in panel.find_all("a", href=True):
        href = a["href"]
        if not href.startswith("http") or "google" in href or "gstatic" in href:
            continue
        title_el = a.select_one("div.QbLC8c")
        meta_el = a.select_one("div.pojp0c")
        title = title_el.get_text(strip=True) if title_el else a.get_text(strip=True)
        meta = meta_el.get_text(strip=True) if meta_el else ""
        source, time_ago = "", ""
        if meta:
            parts = meta.split("\u25cf")
            time_ago = parts[0].strip() if parts else ""
            source = parts[1].strip() if len(parts) > 1 else ""
        if title:
            articles.append({"title": title, "url": href, "source": source, "time": time_ago})
    return articles
The function looks for a div.EMz5P panel, then finds all anchor tags with href attributes. Links to google.com and gstatic.com are filtered out. Each article gets its title (from div.QbLC8c), URL, source, and time (parsed from a div.pojp0c element split on a bullet character).
The detail extraction loop clicks each row:
if fetch_articles and trends:
    limit = min(max_details, len(trends))
    for i, trend in enumerate(trends[:limit]):
        actions = [
            {"Action": "Wait", "Timeout": 5000},
            {"Action": "Wait Selector", "Selector": "table tbody tr[data-row-id]"},
            {"Action": "Click", "Selector": f'table tbody tr[data-row-id="{i}"]'},
            {"Action": "Wait", "Timeout": 3000},
        ]
        resp = requests.get(build_api_url(actions), timeout=120)
        if resp.status_code == 200:
            detail_soup = BeautifulSoup(resp.text, "html.parser")
            trend["articles"] = extract_articles(detail_soup)
The max_details variable caps how many trends get the detail pass, since each expansion requires a separate API call with full browser rendering. For US trends over 24 hours, the scraper typically pulls 25 trending topics with search volumes ranging from 20K+ to 500K+.
Saving the Output
The result dict contains metadata (geo, hours, total_trends) and the full trends array:
result = {"geo": geo, "hours": hours, "total_trends": len(trends), "trends": trends}

with open("trending-now.json", "w", encoding="utf-8") as f:
    json.dump(result, f, indent=2, ensure_ascii=False)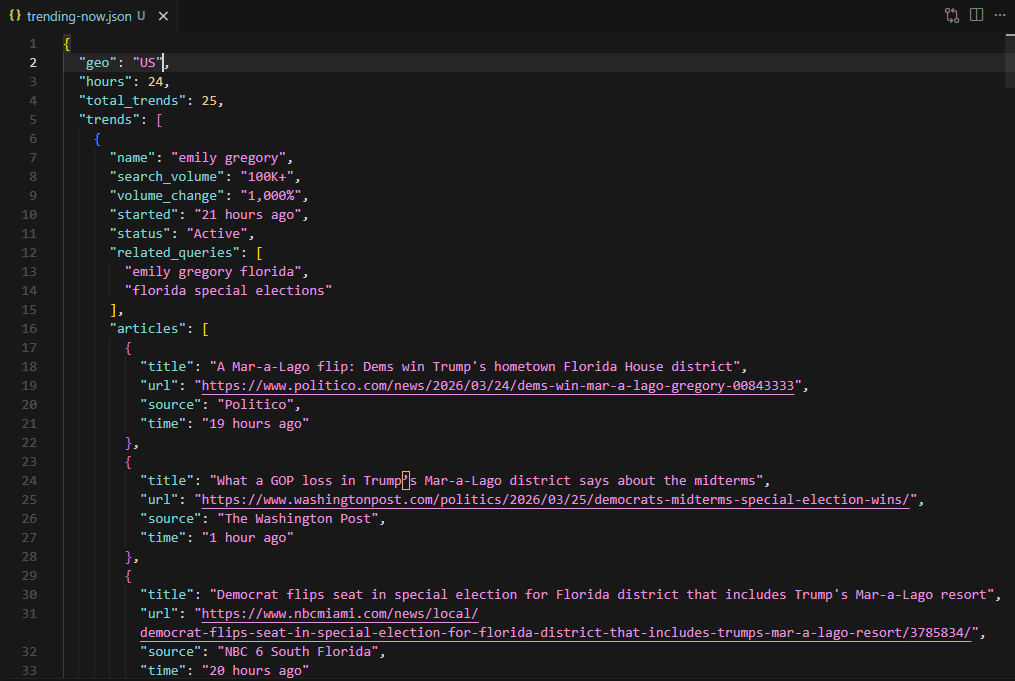
Each trend entry includes name, search_volume, volume_change, started, status, related_queries, and articles. The terminal prints the top 5 trends with their volume, change, article count, and first 3 related queries.
Conclusion
Two approaches, two different data sources.
The explore data scraper uses the internal API token flow: fetch widget tokens from /explore, then exchange each token for interest-over-time, regional breakdown, and related query data. No browser rendering needed. Fast and cheap on API credits.
The Trending Now scraper requires full browser rendering through Scrape.do's render=true, super=true, and playWithBrowser to handle the JavaScript-heavy page. A two-pass approach (table fetch, then row click for detail panels) extracts trending topics with associated news articles.
Both scripts output structured JSON. Plug them into analytics pipelines, dashboards, or content research workflows.
Get 1000 free credits and start scraping with Scrape.do
FAQ
How does Google Trends score interest over time?
Google Trends normalizes search interest on a 0-100 scale relative to the peak point in the selected timeframe and region. A score of 100 represents the maximum search interest during that period. A score of 50 means half the peak popularity. A score of 0 means insufficient data. The values are relative, not absolute search counts.
What is the difference between "top" and "rising" related queries?
Top queries are the most popular related search terms by overall volume during the selected timeframe, scored 0-100 relative to the most common related query. Rising queries show the largest increase in search frequency compared to the previous period, displayed as percentage changes (e.g., "+1,050%"). A "Breakout" label appears when the increase exceeds 5,000%.
Why does the Trending Now scraper need browser rendering but the explore scraper does not?
The explore scraper targets the internal API endpoints (/trends/api/explore and /trends/api/widgetdata/) directly. These endpoints return raw JSON data that requires no JavaScript execution. The Trending Now page at /trending loads an empty HTML shell and populates the trends table entirely through client-side JavaScript. Without a browser executing that JavaScript, the response contains no trend data.
How often does Google update Trending Now data?
Trending Now updates in near real-time. New trends appear as they gain traction, and existing trends update their search volume and status (Active/Ended) continuously. The hours parameter (4, 24, 48, or 168) controls how far back the page looks, not the update frequency.
Can the explore scraper compare multiple keywords?
The internal API supports multi-keyword comparison through the comparisonItem array in the explore request. The current script sends a single item, but extending it to multiple keywords requires adding more entries to that array and adjusting the value extraction to handle multiple indices in each data point.
Head of Marketing