HAR File Analyzer and Viewer
Drop a HAR file from Chrome, Edge, Firefox or Safari and see every request with its status, size, timing, headers, cookies and response. One click filters it down to the JSON API calls behind the page, and any request copies as cURL, Python requests or a Scrape.do call. The file is parsed in your browser and never uploaded.
- Free, no signup
- Runs in your browser
- Nothing is uploaded
Drop a .har file here
Exported from Chrome, Edge, Firefox or Safari DevTools. Big files are fine: a 64 MB HAR opens in under a second.
Processed in your browser. Your HAR file is never uploaded: the tool sends no network request with your data, and it is gone when you close the tab.
How to use the HAR analyzer
- Export a HAR file from your browser's Network panel. The steps for each browser are below.
- Drop it on the box above, choose it with the file picker, or paste the JSON. No HAR at hand? Click Try a sample HAR for a real recording of a few test calls to httpbin.co.
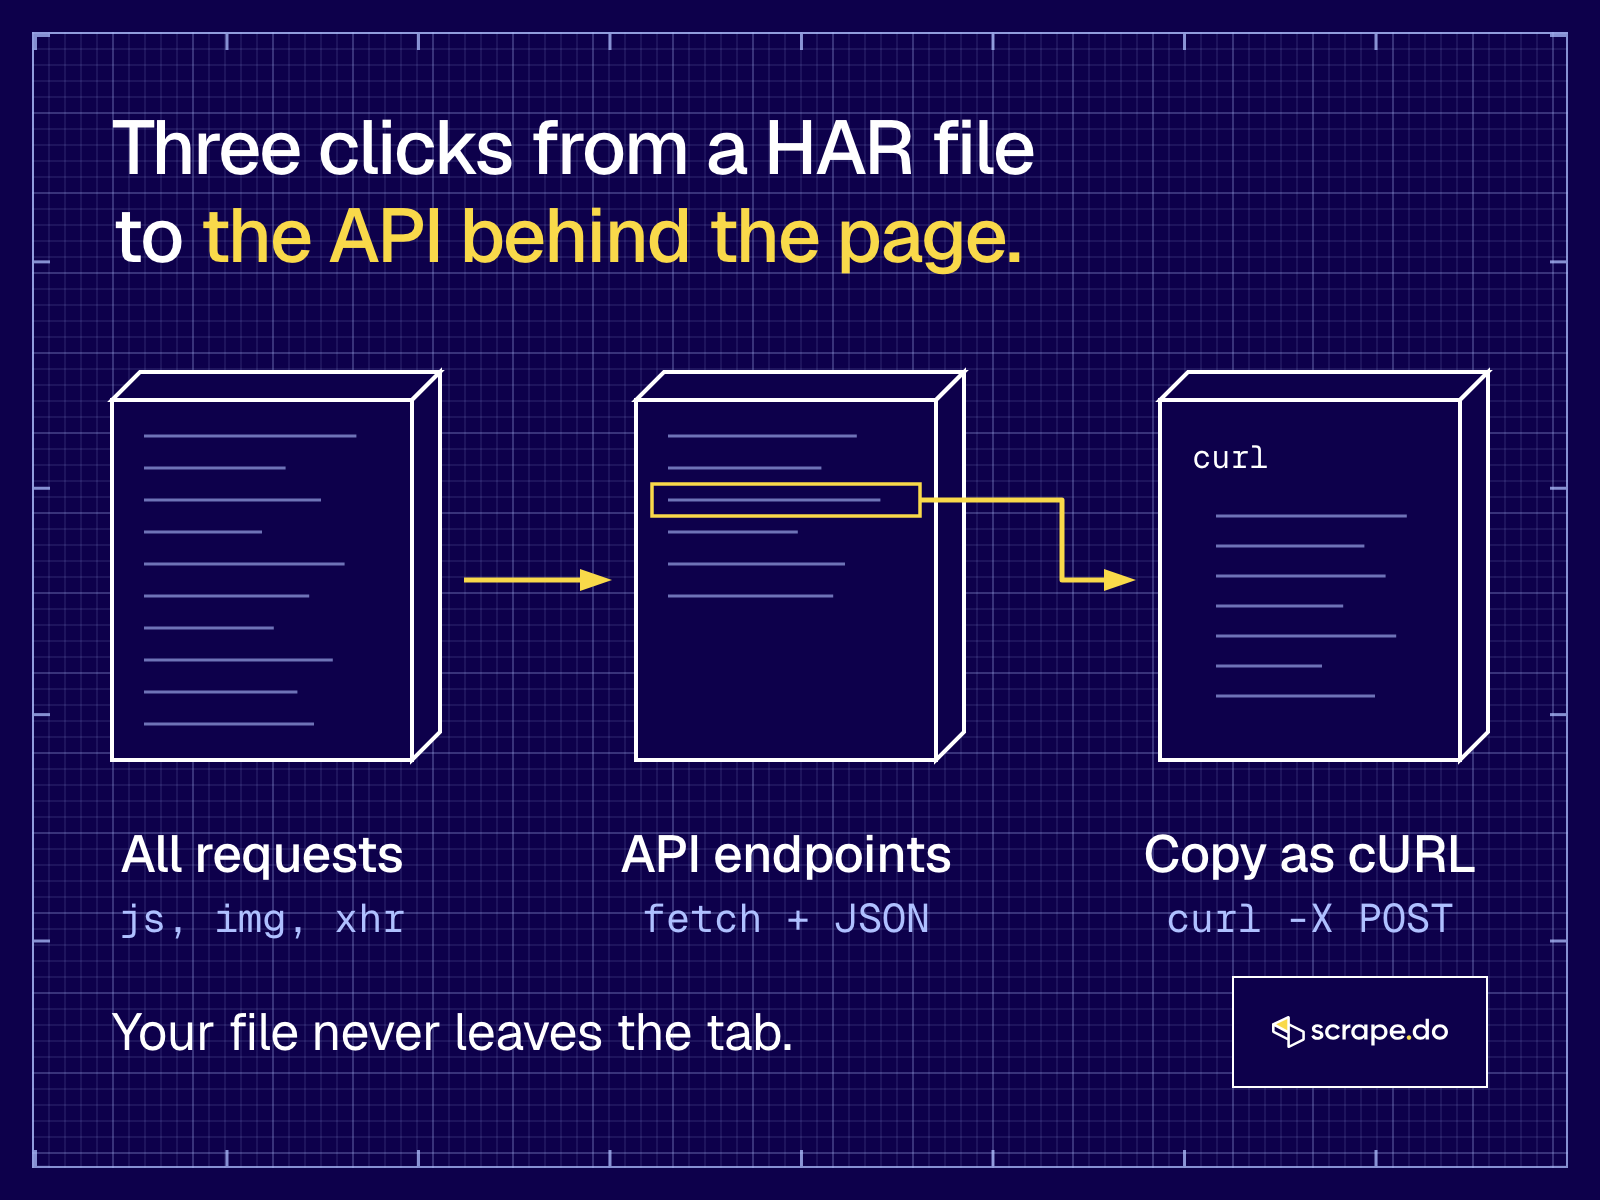
- Click Find API endpoints. The table drops to the JSON calls the page made after it loaded.
- Click a request to see its headers, payload, query string, cookies, pretty-printed response and timing, or to copy it as code.
- Sanitize and download before you send the file to anyone.
You can also filter with method:POST, status:4xx, domain:api. or larger-than:50k, and exclude noise with a minus sign, like -analytics.
What is a HAR file?
A HAR (HTTP Archive) file is a JSON log of every request your browser made while DevTools was recording: URLs, methods, headers, cookies, timings and, in most exports, the response bodies. The format is HAR 1.2, and Chrome, Edge, Firefox and Safari all export it from the Network panel.
That makes it the most complete record of how a page loads.
The HTML you see in View Source is often an empty shell. The products, prices, reviews and search results arrive later, through API calls the page makes in the background. A HAR file has all of them, in order, with the exact headers the browser sent.
What's inside a HAR file?
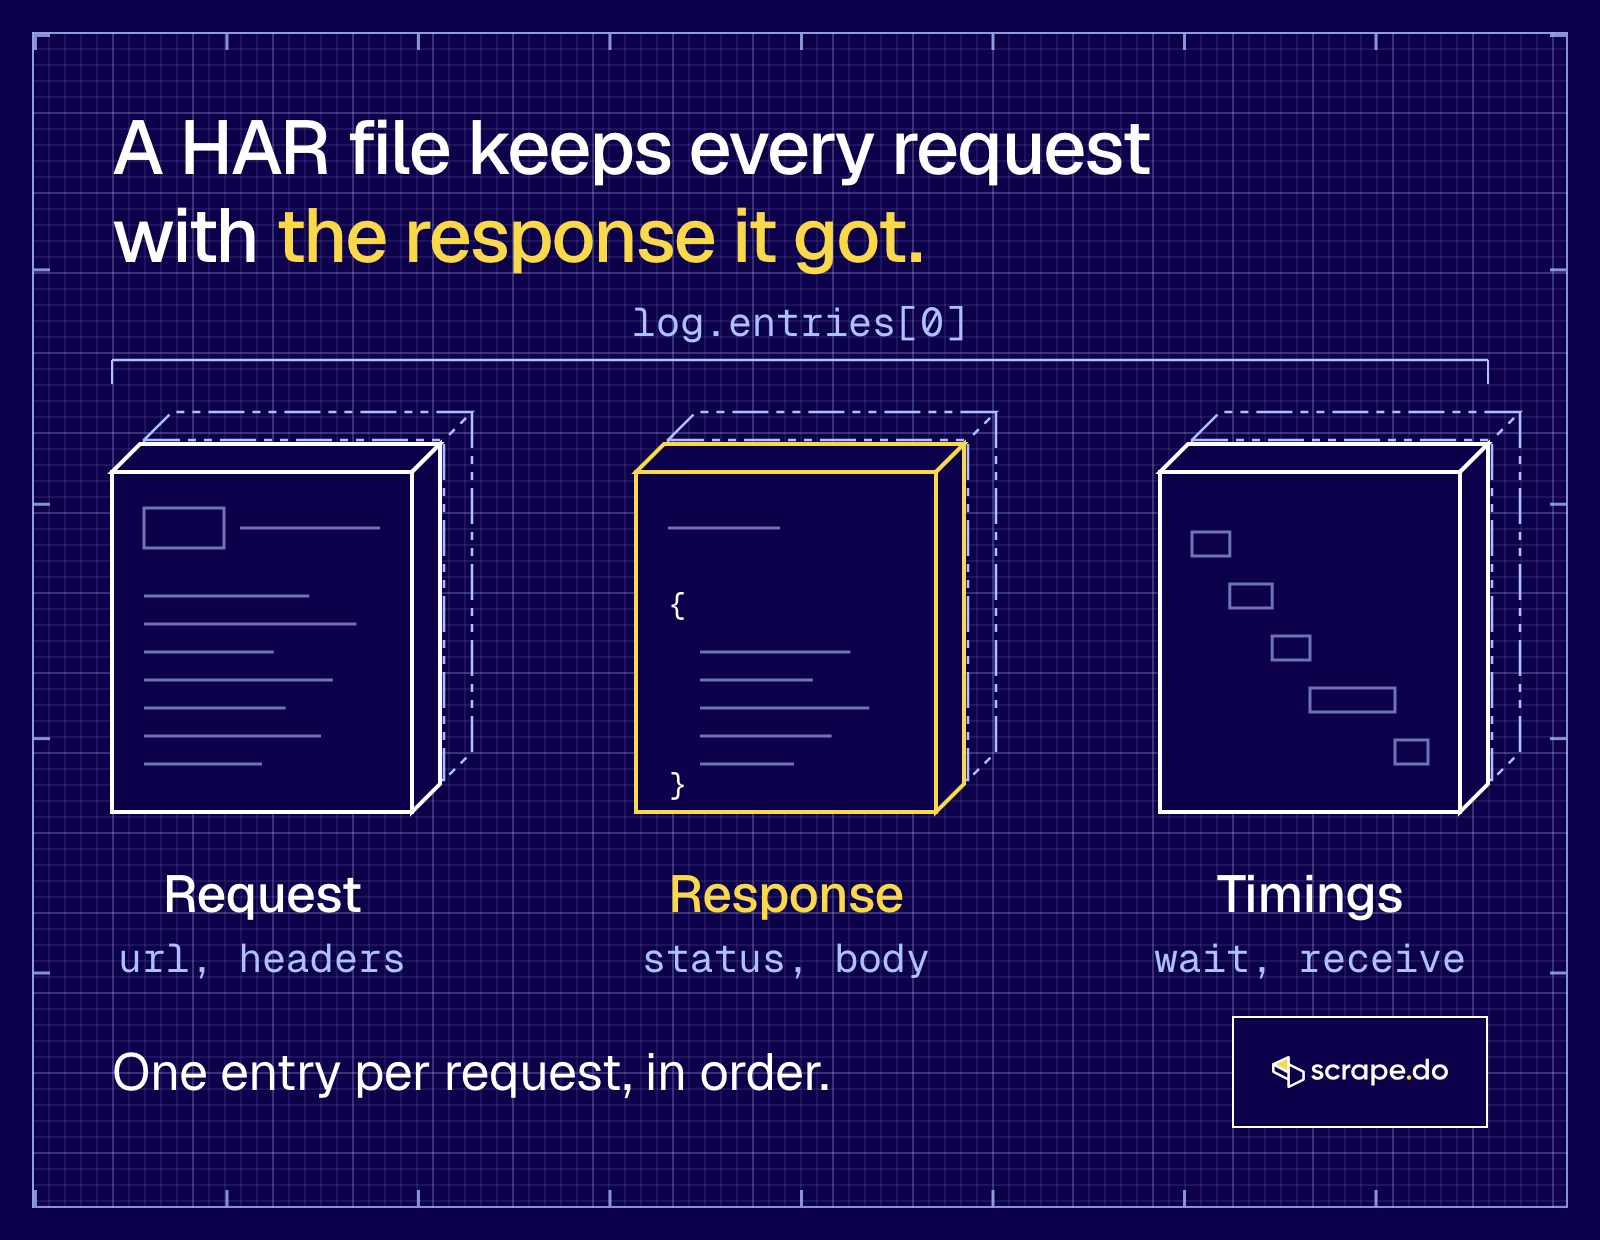
Open one in a text editor and you'll see one log object. Its entries array has one object per request, and each entry has the same parts:
| Part | What it holds |
|---|---|
request | Method, URL, HTTP version, headers, cookies, query string and the body (postData) |
response | Status code, headers, cookies, redirect URL and content: the MIME type, size and the body as text (base64 for binary files) |
timings | Milliseconds spent blocked, on DNS, connecting, on TLS, sending, waiting for the first byte and receiving |
startedDateTime, time | When the request started and how long it took in total |
pageref | Which page load it belongs to, matched against log.pages |
Chrome and Edge add their own fields with an underscore, like _resourceType (fetch, script, image) and _initiator. This viewer uses them to tell API calls from everything else.
How to export a HAR file
Start recording before the page loads, then do the thing you want to capture: search, scroll, click to page 2, log in.
Chrome
- Open DevTools with F12 or Ctrl+Shift+I (Cmd+Option+I on a Mac).
- Open the Network panel and tick Preserve log, so redirects and reloads don't clear the list.
- Reload the page and do what you want to capture.
- Click the Export HAR (sanitized) button, the download arrow in the Network panel's action bar.
The sanitized export leaves out Cookie, Set-Cookie and Authorization. If you need them to replay a logged-in call, go to Settings > Preferences > Network, tick Allow to generate HAR with sensitive data, and pick Export HAR (with sensitive data) from the export button.
Edge
Edge uses the same DevTools as Chrome.
- Right-click the page and choose Inspect.
- Open the Network tool and tick Preserve log.
- Reload the page and do what you want to capture.
- Click Export HAR (sanitized).
For cookies and auth headers, open Customize and control DevTools > Settings > Preferences > Network, tick Allow to generate HAR with sensitive data, then use the export button's menu to pick Export HAR (with sensitive data).
Firefox
- Open the Network Monitor with Ctrl+Shift+E (Cmd+Option+E on a Mac).
- Turn on Persist Logs in the Network toolbar's menu of extra actions.
- Reload the page and do what you want to capture.
- Right-click any request in the list and choose Save All As HAR.
Safari
- Go to Safari > Settings > Advanced and tick Show features for web developers.
- Open Web Inspector with Option+Command+I, then the Network tab.
- Reload the page and do what you want to capture.
- Click Export (or press Command+S) to save the HAR.
How do I open a HAR file?
Drop it on the HAR viewer at the top of this page. It opens in your browser, nothing is uploaded, and you get the request table, filters and copy as code. You can also import a HAR into the Network panel of Chrome, Edge, Firefox or Safari, or open it in any text editor, since it's plain JSON.
Each way has its use:
- This viewer when you want the API calls, code to replay them, or a sanitized copy to share.
- DevTools when you want the exact panel you already know. It shows the requests and copies them as cURL, but it can't redact secrets or write a Scrape.do call.
- A text editor for a quick search through a small file. A HAR from a busy page runs to tens of megabytes, so a viewer is easier.
Find hidden APIs in a HAR file
The fastest scraper for most modern sites doesn't parse HTML at all: it calls the same JSON API the page calls.
Our DoorDash guide does this with a GraphQL query copied from DevTools, and the Amazon guide finds the sellers endpoint the same way. The Google Maps guide starts from a request URL in the Network tab too. The HAR analyzer makes that search take seconds instead of an afternoon.
- Record the page doing the thing. If you want page 2 of search results, click to page 2 while recording. The request that loads page 2 is the one you want.
- Click Find API endpoints. In the sample file, that keeps 6 of 10 requests.
- Sort by Size. The biggest JSON response is usually the data you saw on the page.
- Open it and check the Response tab. Search for a product name or a price you saw. If it's there, you found the endpoint.
- Read the Query and Payload tabs. That's where the knobs live:
page=2,first: 20,sort=price, a category ID. Change them and you change what comes back. - Copy it as cURL and run it in a terminal. If you get the same JSON, you have your scraper.
If step 6 gives you a 403, a challenge page or empty JSON, the site is checking who's asking. That's usually cookies tied to a session, an IP with a bad reputation, or a TLS fingerprint that doesn't match the User-Agent your script claims. Our guide to 403 errors in Python requests walks through each one.
Copy as cURL, Python or a Scrape.do call
Every request in the drawer copies three ways:
- cURL with the headers, cookies (
-b) and body the browser sent. - Python requests with
params,headers,cookiesandjsonsplit out, so you can change one value without hunting through a long string. - A Scrape.do call that sends the same request through the Scrape.do API, with the target URL encoded and
<your_token>in place of your API token.
The Scrape.do version keeps the headers that matter to the site (API keys, Referer, Origin, custom x- headers) and lets Scrape.do generate the browser headers, so they match the proxy and fingerprint. That's the extraHeaders mode: headers with an sd- prefix reach the site without the prefix. This is the call the tool generated for the GraphQL request in the sample, and it returned a 200 with the body and headers intact when we ran it:
curl 'https://api.scrape.do/?token=<your_token>&url=https%3A%2F%2Fhttpbin.co%2Fanything%2Fgraphql&extraHeaders=true' \
  -H 'sd-accept: application/json' \
  -H 'sd-origin: https://httpbin.co' \
  -H 'sd-referer: https://httpbin.co/html' \
  -H 'Content-Type: application/json' \
--data-raw '{"operationName":"SearchProducts","variables":{"query":"laptop","first":20},"query":"query SearchProducts($query: String!, $first: Int) { search(query: $query, first: $first) { id name price } }"}'One detail we hit while building this: the API rejects setCookies when extraHeaders is on (it answers 400 and asks for a Cookie header instead). So in that mode the tool sends your cookies as an sd-Cookie header, and uses setCookies only when no other header is needed. You can also switch to customHeaders, which forwards every recorded header as is.
HAR viewer: what each column means
The table reads like the Network panel you already know.
| Column | What it shows |
|---|---|
| Name | Method and the last part of the path. A yellow JSON tag marks API endpoints. |
| Status | HTTP status code, or "failed" when the request never got a response. |
| Type | fetch, document, script, stylesheet, image, font, media, websocket or other. |
| Domain | The host. Use the domain filter to hide third parties. |
| Size | Bytes transferred over the network, or "(cache)" when it came from the browser cache. |
| Time | Total time from start to the last byte. |
| Waterfall | When each request started and how long it took, split into connecting, waiting for the server (TTFB) and downloading. |
Click any column header to sort. Arrow keys move between rows and Enter opens one.
What else can you do with a HAR analyzer?
Finding APIs is what we built it for, but the same file answers the usual debugging questions:
- Why is the page slow? Sort by Time and read the waterfall. A long waiting segment means a slow server; a long chain of requests that start one after another means the page loads things in sequence.
- What failed? Filter with
status:4xx,status:5xxor look for "failed" in the Status column. - What do third parties cost? Filter by domain, or exclude your own with a minus sign, and sort by Size.
- What do I send to support? A sanitized HAR. It keeps every request and drops the secrets (next section).
Is it safe to open a HAR file in an online HAR file viewer?
It depends on the viewer. A HAR file can hold session cookies, Authorization headers, API keys in URLs and whatever personal data the pages showed, so uploading it to a server you don't control is like handing over a logged-in browser. This HAR file viewer never uploads anything: parsing happens in your tab.
Before you attach a HAR to a support ticket or a Slack thread, use Sanitize and download. It replaces the values of:
CookieandSet-Cookieheaders, plus the cookie listsAuthorization,X-API-Key, CSRF tokens and headers named like a token, session or secret- query parameters like
token,access_token,key,sessionandsignature, plus anything shaped like a JWT - secret-looking fields (
password,token,api_key) inside JSON, form and multipart bodies
Values become [REDACTED], so the file stays a valid HAR and whoever reads it can still see which headers were there. You can also drop every response body when the pages showed orders, messages or account details.
These rules catch the usual names, not every secret a site can invent. Open the sanitized file once before you share it.
Related reading
- How to Scrape DoorDash, with a GraphQL query found in DevTools
- Cookie Handling in Web Scraping
- Why You're Getting 403 in Python Requests
- How to Use curl_cffi for Web Scraping, for replays that need a browser TLS fingerprint
- HTML to Markdown Converter, for when the data is in the HTML after all
More free tools
All free toolsF.A.Q
Frequently asked questions
No. The file is read and parsed by JavaScript in your browser tab, and the tool makes no network request with your data. Session recording and click tracking are turned off for the tool area too. Close the tab and the data is gone.
We recorded a 64 MB HAR with 2,319 requests from our own site to test it. It parsed in 246 ms in headless Chrome on an 8 GB Mac, and scrolling the table stayed at about 56 frames per second, because only the rows on screen are rendered. A 204 MB file with 8,360 requests took 0.7 seconds in the same test.
Chrome and Edge export a sanitized HAR by default, which leaves out the Cookie, Set-Cookie and Authorization headers. To keep them, turn on Allow to generate HAR with sensitive data under DevTools Settings, Preferences, Network, then pick Export HAR (with sensitive data). Only do that for files you keep to yourself.
It keeps the requests made by fetch() or XMLHttpRequest whose response is JSON, and hides everything else (documents, scripts, styles, images, fonts). On most modern sites, that's where the data on the page actually comes from.
The site is checking more than the URL and headers. Session cookies expire, some tokens are tied to one IP, and many anti-bot systems compare the client's TLS fingerprint with its User-Agent, which a Python or cURL client can't match. Copy the request as a Scrape.do call to send it through rotating proxies with a real browser fingerprint. See why replayed requests get blocked.
No, it's a different tool for a different job. Google's Admin Toolbox HAR Analyzer is built for support tickets: it lists the requests and flags errors. This one is built for scraping: it finds the API calls behind a page, copies them as cURL, Python or a Scrape.do call, and redacts cookies and tokens before you share the file.